SYS/08 · DATA ANALYTICS
Project Performance Monitoring Dashboard
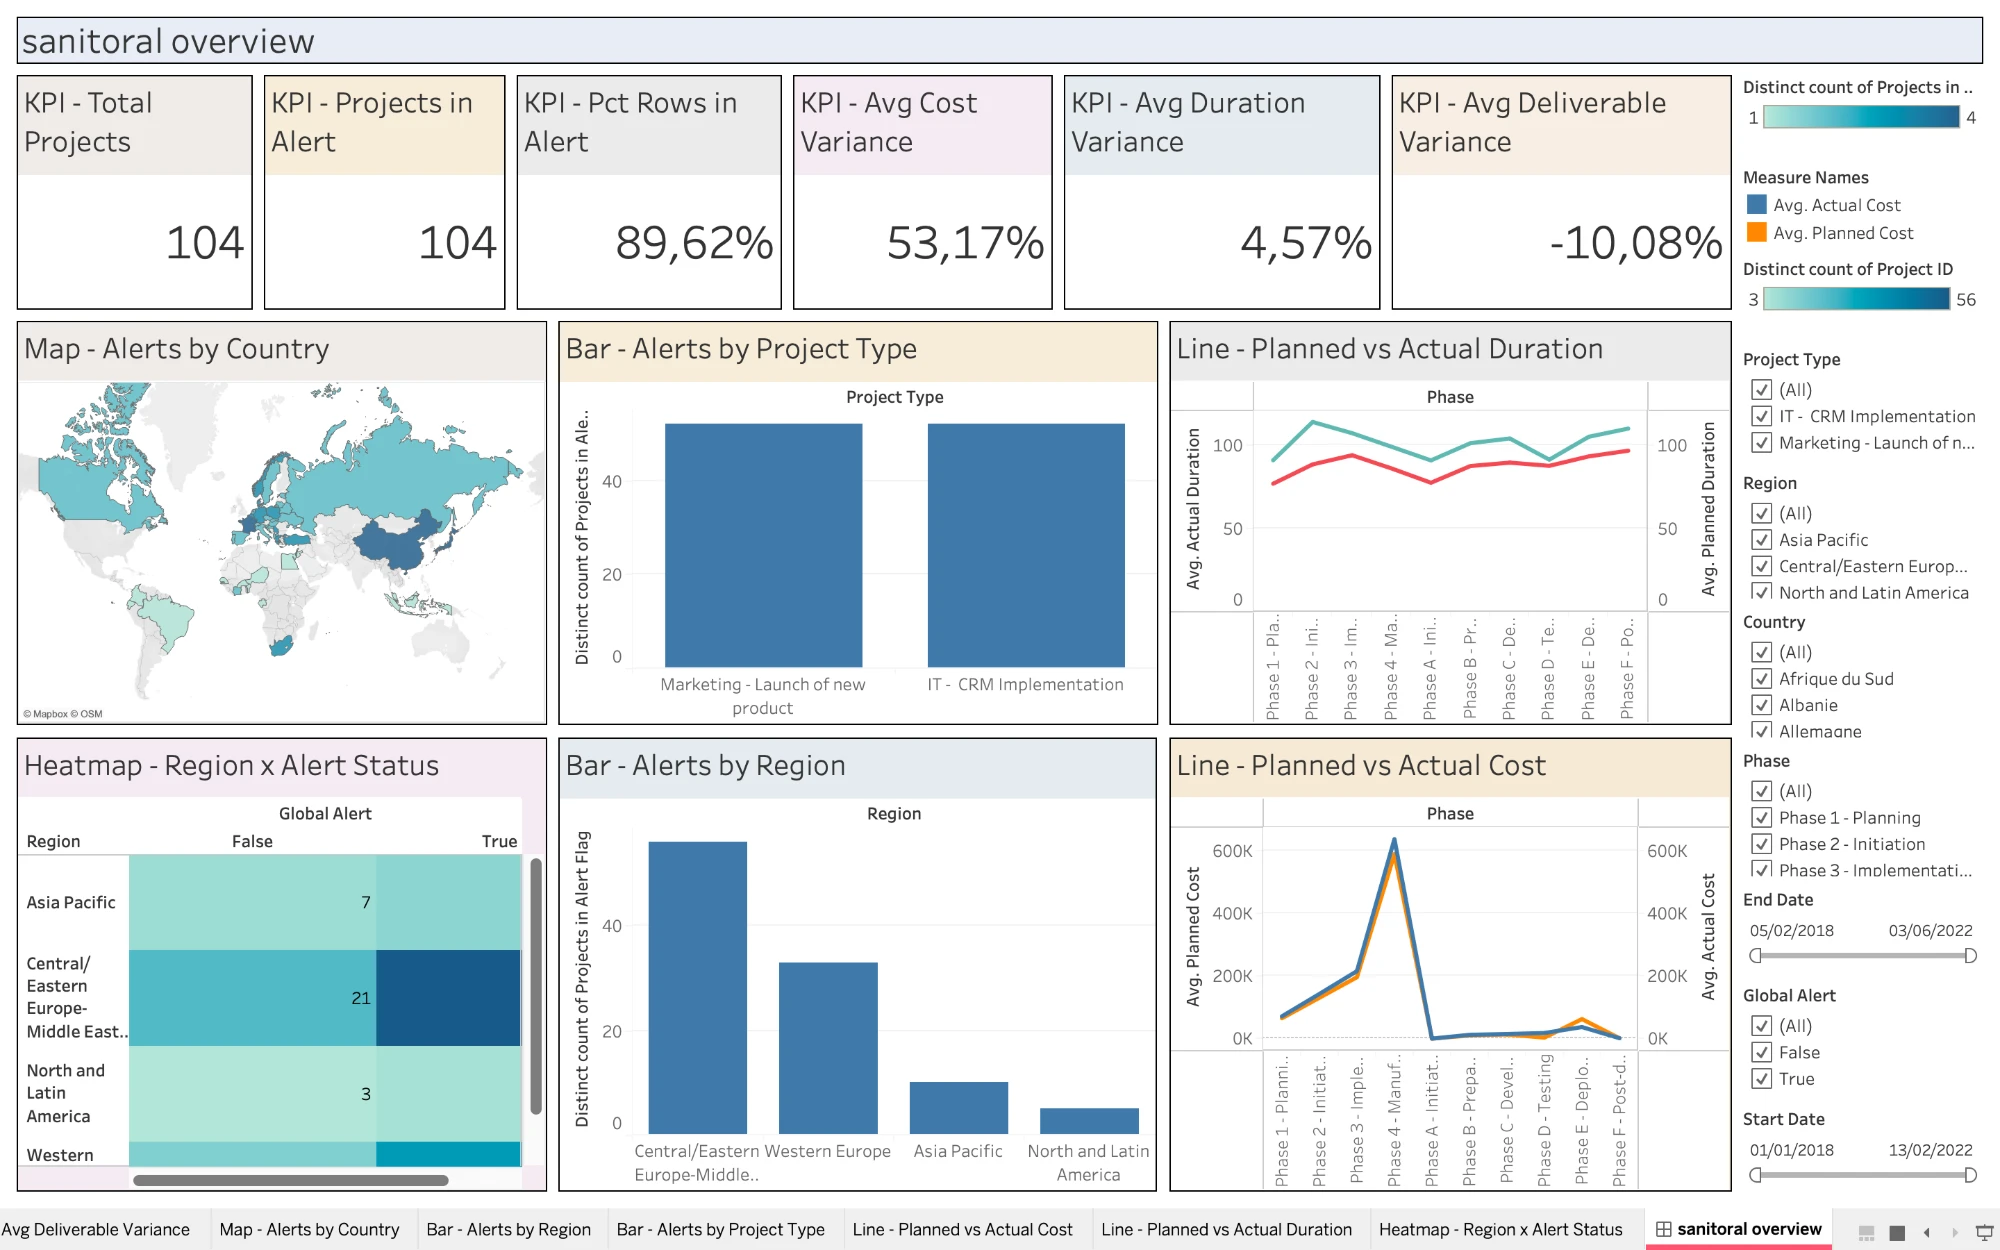
Tableau dashboard tracking planned vs. actual cost, duration, and deliverables across 520 project-phase records, with automated exception alerts.
- RECORDS
- 520
- FIELDS
- 20
- TOOL
- Tableau
A Tableau dashboard built on 520 project-phase records across 20 fields, tracking planned vs. actual cost, duration, and deliverables with variance % and automated alert flags, broken down by region, country, and project phase.
KEY FACTS
- 520 project-phase records across 20 fields.
- Tracks planned vs. actual cost, duration, and deliverables, with variance % for each.
- Automated alert flags for projects breaching cost or duration thresholds.
- Broken down by region, country, and project phase.
What it tracks
Six KPI tiles (total projects, projects in alert, percent of rows in alert, and average variance % for cost, duration, and deliverables), a world map and bar charts of alerts by country/region/project type, a region-by-alert-status heatmap, and planned-vs-actual line charts for both cost and duration across project phases.
Exception logic
Custom cost, duration, and deliverable alert flags fire whenever a project phase breaches its threshold, rolling up into a single global alert flag per record so at-risk phases surface immediately rather than requiring a manual scan of the raw data.